
Recently, I wanted to find out what percentage of users would upgrade once a new version of an app became available. I didn’t find any good answers to this question so I decided to try to answer the question myself. Looking at the historical stats available for a few different apps (all < 100k installs) the data is definitely skewed to the left. Here’s a pretty representative example:
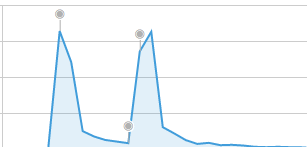
Those grey indicators show when a new upgrade was pushed to the Play Store. There’s actually 2 upgrades in this image with ~30 days of history showing on the one on the right. After 30 days the number of upgrades becomes negligible. While I didn’t go so far as to create a distribution plot, I think it’s reasonable to say that based on the available data roughly 65% of all upgrades occur within the first 3 days and 90%+ within the first 2 weeks of a new release. It’s probably also reasonable to conclude that the average android user upgrades his/her apps within 3 days of the upgrade becoming available. If I were ambitious I might even take a stab at estimating the % of users that have auto upgrade enabled but I’ll leave that for another day. It’s worth pointing out that these statistics show what percentage of upgrades will occur within a given time frame but do not take into account the number of derelict installs (users who still have the app installed but for whatever reason never upgrade). You can roughly figure out how many “derelict” users you have by comparing the sum of installs over a 30 day period (or longer if you prefer) against the total number of active users the Play Console claims your app has at the end of that period. Or if you’re impatient and willing to trust my conclusions you can use 3 day statistic:
D = "derelict users"
S = sum of day1, day2 and day3 upgrades
T = Play store reported "active" installs as of day3 above

D = (T*1.54) - S